 |
|---|
Eye Tracking Research
Exploratory eye tracking study on Intersection's digital signage products to analyze users innate interactions.
At Intersection, our design team is obsessed with understanding how people exist in physical spaces and cities. Our products strive to help individuals navigate through cities and transit systems by providing from maps and real time information to assist with navigation. From mobility to connectivity, technology has impacted how people exist in cities, but how has technology changed the way we design? The following will give you a glimpse into our process. How we learn, how we experiment with new methods, and over time how we push to make better products.
When improving products, we focus on understanding the pain points a person experiences so we can form new insights. This helps us to make improvements. Through interviews and usability research we are able to attain qualitative information to better understand the holistic experience when using our products. But the question remains, how can we place ourselves in the perspective of a person to analyze their innate process? What do people actually look at? On what part of the screen do their eyes fixate? To try and answer this we rented a pair of Tobii Eye Tracking Glasses to conduct a study on individuals innate perception of our digital products — specifically our IxNTouch interface to understand customer behavior.
Role: Lead UX Researcher
Deliverables: Background Research, Participant Recruitment & Coordination, Research Plan Documentation, Testing Script, Gaze Plot & Heat Map Artifacts, Result & Insight Summaries
Materials: Tobii Pro Glasses 2, Tobii Eye Tracking Software

Research
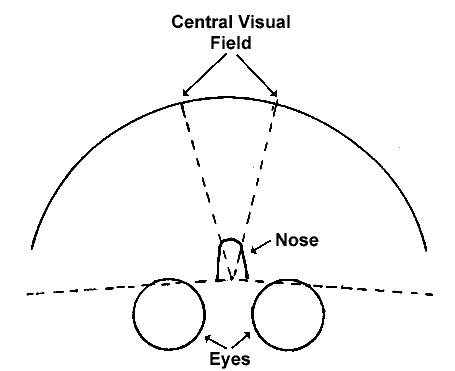
Initially, we conducted research on our vision. We found that our visual field spans 135 x 220 degrees; however, we can only see 1% of this field at any point in time (Essen & Andersson, 1995 as cited in Tobii Pro). With such a limited range of sight, we began to question what actually grabs our attention when interacting with our digital products in a congested area.

Eye Tracking is a scientific tool used to monitor the position and movement of one’s gaze. This device is often used in Psychology and Biology research, as well as marketing and design to understand customer perception of digital and physical products.
We conducted a two-week study to further understand how people interact with our digital products.
Resources
[1] Tobii Pro. Why do we move our eyes?. Retrieved fromhttps://www.tobiipro.com/learn-and-support/learn/eye-tracking-essentials/why-do-our-eyes-move/
[2] Van Essen, D.C. & Anderson, C.H. 1995. Information Processing Strategies and Pathways in the Primate Visual System. In: An Introduction to Neural and Electronic Networks, 2nd ed., 1995, Academic Press, Zornetzer et al., eds., pp. 45–76.
How might we analyze users innate behavior while interacting with our digital signage?

Eye Tracking Basics
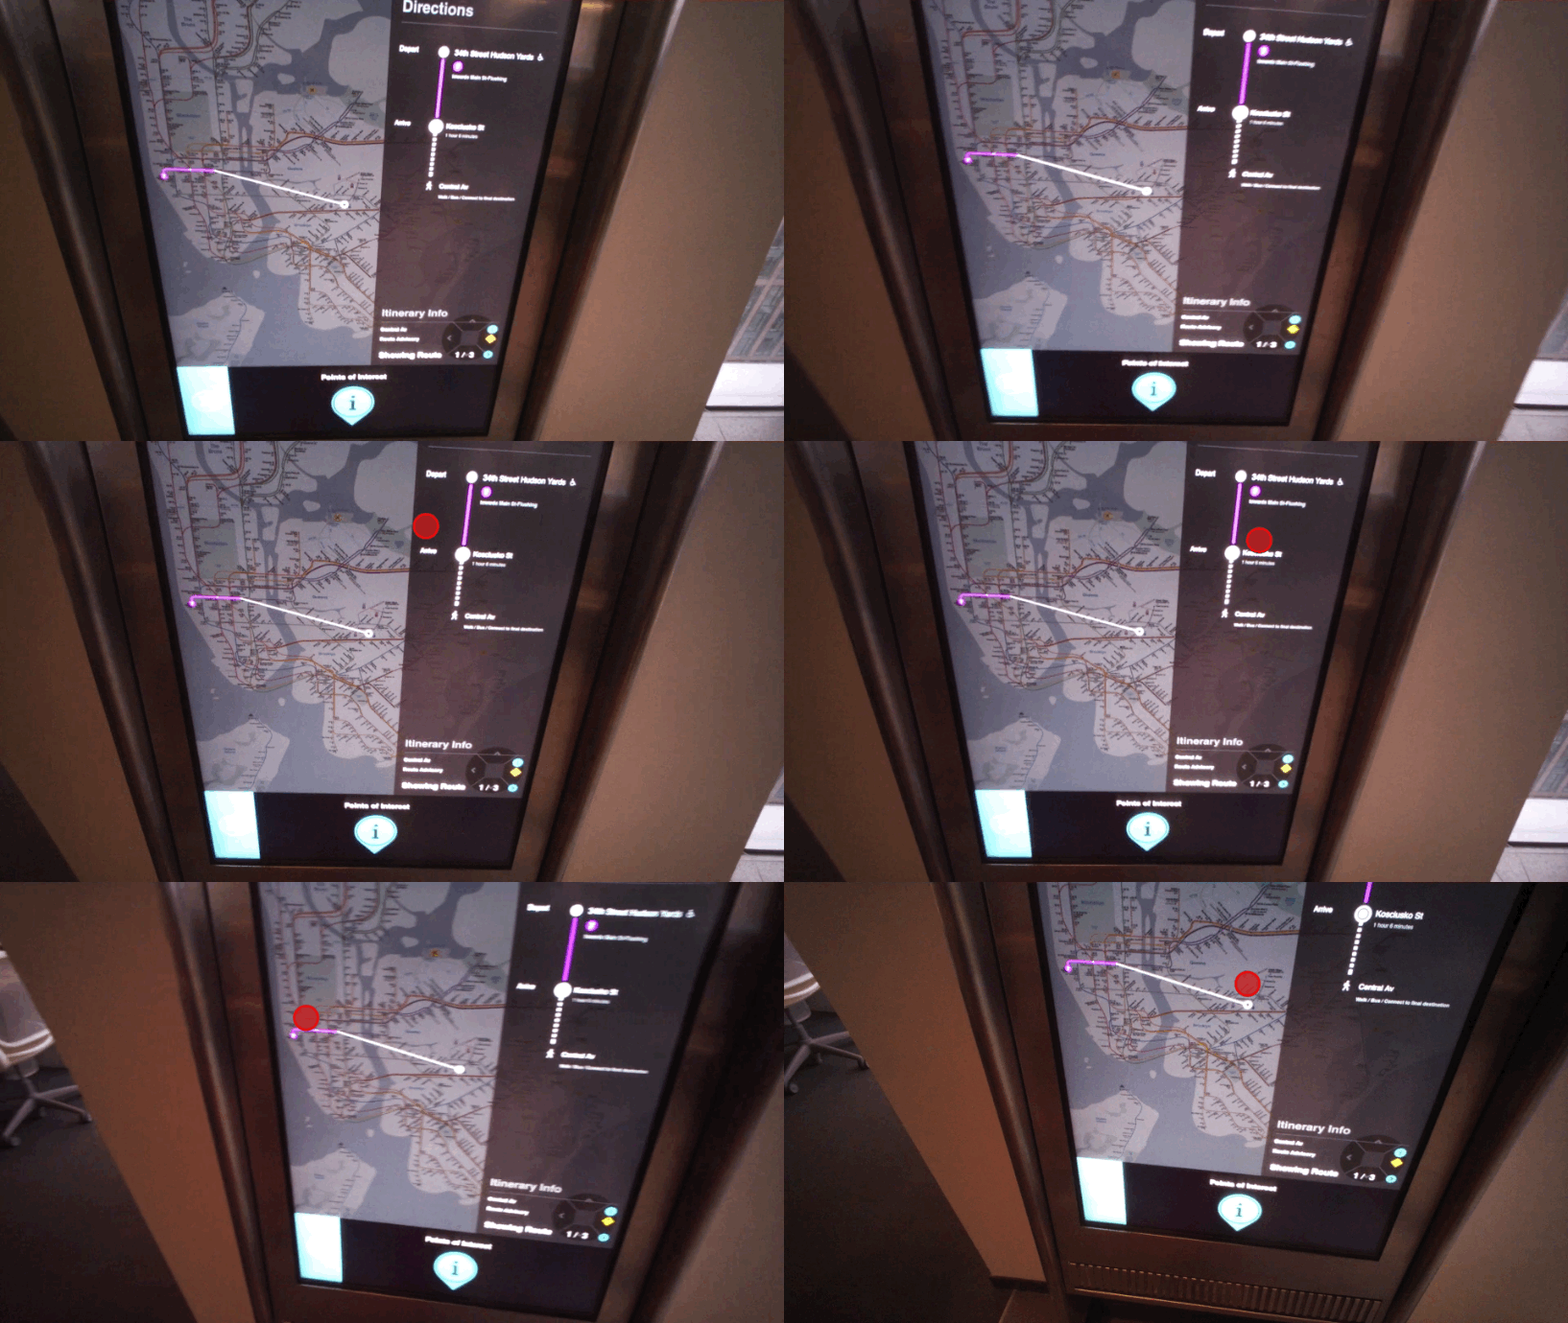
We used a pair of Tobii Pro Glasses 2 to gather data. These glasses are completely mobile and provide full range of motion, allowing us to gather information in a real world environment without being confined to a testing lab. The embedded camera in the Tobii Pro Glasses 2 records the relationship between the pupil and glint (the white glimmer of light in one’s eyes) to determine the area of focus. The camera at the front of the lens provides a first person view of the users’ experience, which is an invaluable asset for reviewing testing sessions.

Eye Tracking video footage is recorded by the camera at the front of the lens. Then using the Tobii Pro Software, this footage can be transformed into heat maps and gaze plots. These visualizations can show different kinds of information.
Heat Maps
“Heat maps show how looking is distributed over the stimulus… heat maps are a visualization that can effectively reveal the focus of visual attention”
- Tobii Pro
In heat maps, colors indicate fixation length. When the timeframe is selected the the software creates a plot for every coordinate that the user looks at. The heat map shows how long individuals have been looking at each section: the warmer colors indicate a longer fixation length.


Gaze Plots
“Gaze plots show the location, order, and time spent looking at locations on the stimulus”
- Tobii Pro
Gaze plots show the users path as they scan an interface. The circles indicate fixation points. The number on the circle represents the order at which the user looked at the particular point. The size of the circle shows the length of the fixation, meaning that the longer fixation period has a larger diameter. The line represents that the path that the user scanned the scene.
Process
We began this study by conducting research on eye tracking and how it is used to examine a digital product's usability. By understanding how other digital products are studied, we decided to conduct an experiment on our IxNTouch devices. We created a testing plan with a script to follow for consistency. When we retrieved the Tobii Pro Glasses, we took part in an instructional class to understand how to calibrate the device and how to create the visualizations.
We then recruited several volunteers that live or work in New York City. We instructed the participants to interact with our IxNTouch devices by finding a route to a particular destination, finding points of interest and reviewing the detail page for a subway line. We asked the participants to speak aloud so we could understand their thought process and then reviewed the video footage along with their qualitative interview to formulate insights.

Findings
We used the accompanying Tobii Pro Software to analyze the participants’ video footage and to develop heat maps and gaze plots. Comparing the data artifacts with the participant’s qualitative research revealed information about perception.


During the testing, all of the individuals were able to find a route to the particular destination. In reviewing the footage, we found that the design of the map and route information influenced where individuals were looking. When the map and route details were both highlighted, individuals gaze fluctuated between both sides of the screen. However, when an overlay was placed on the map, the user only focused on the route information. In these scenarios the users spent more time analyzing the details of the chosen route.

All of the users were able to navigate to the Points of Interest page. This section allows users to see a list of New York sightseeing activities. The gaze plots of this screen shows that the individuals were focused on the left side of the display. Their eyes jumped from text to text and did not gaze at the images. Although the images take up a considerable amount of the screen users were focused on the text.

Finally, the detail page of a subway line provides information including a basic overview, interesting facts and a list of all the stops. Although all the users were able to navigate to this page and answer questions about its content, the eye tracking data shows that their gaze moved constantly around the screen. The users scanned the details first and then looked at the close button and the bottom navigation. A lack of hierarchy of the information on this page led to the disarray of gaze plots. If this page had a more structured design, it would probably provide an easier gaze path to understand the data.
Technology Review
We conducted this study using the Tobii Pro Glasses 2. Overall this technology allowed us to gain a plethora of quantitative data about our participants innate behavior; however, this device has several shortcomings. Eye tracking glasses has several cameras embedded in the interior of the frame that records the distance between the glint and pupil to understand where an individual is looking. When we conducted our study outside, the amount of gaze data significantly decreased. The immense amount of light reflecting from several sources outside makes it difficult for the software to detect the glint; thereby, greatly diminishing the amount of gaze data. In addition, the battery pack connected to the glasses was bulky and required users to hold this device during the study. A more streamlined device would have concealed the technology and perhaps would have encouraged more natural behavior.

Conclusion
This eye tracking experimentation provided invaluable information about how individuals interact with our digital products. We were able to study how individuals interact with our IxNTouch display from the first person perspective and understand what information stood out to them. We were also able to analyze the differences between what individuals say as they were interacting with the interface, and what they see, by inspecting the participant’s visual data. As we expand our suite of digital products, we will continue this research to further understand human perception and wayfinding in cities.
What I learned and the next steps...
-
Eye Tracking is valuable tool to understand how individuals naturally interact with the world. I learned a tremendous amount on human perception and how we naturally scan our environment. I also learned how to calibrate eye tracking devices and then create gaze plots and heat maps from video footage.
-
The next step would be to use the findings to make further design decisions. The points of interest page could be redesigned to reduce the size of the images or contain more areas of interest. The lack of hierarchy on the detail page showed a disarray of gaze plots, therefore, we will improve the layout of this page for easy scanning.
More Work
© 2021 by Angela Delise


